
How To Read Financial Reports: A Beginner Investors Survival Guide
 29
29  1
1  4
4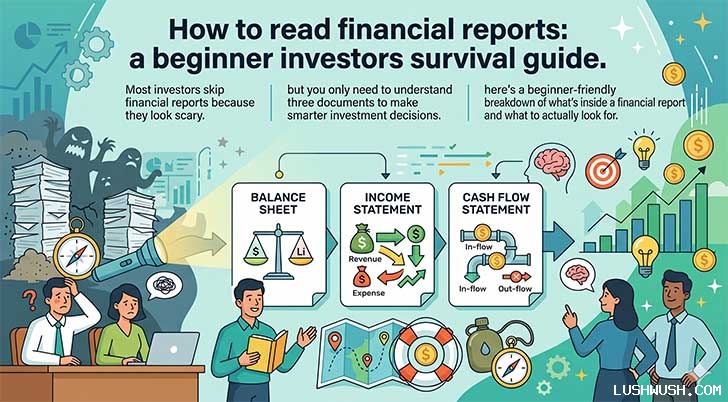
How to Read Financial Reports: A Beginner Investor's Survival Guide
Most people who start investing do the same thing. They find a stock that looks promising, maybe a company they've heard about or a tip from someone they trust, and they buy it. Simple.
Then something goes wrongthe stock drops, the company reports bad earnings, or it turns out the business was struggling long before anyone noticed. And the frustrated investor wonders: "How was I supposed to know?"
The answer, more often than not, was sitting right there in the company's financial report. Available to anyone. For free. Just waiting to be read.
The problem isn't access. The problem is that financial reports look intimidating. Pages and pages of numbers, tables, and accounting language. Most beginners take one glance and close the tab.
But here's what I want you to understand: you don't need to read all of it. You don't need to understand every number. You just need to know where to look and what those three key documents are actually telling you.
What Is a Financial Report, Actually?
Think of a financial report as a company's official update to the world. Companies release these every quarter (every three months) and once a year as an annual report. Inside, you'll find numbers that tell you whether the business is healthy, growing, struggling, or hiding something.
The reason this matters for investors is simple: stock prices can be driven by hype, trends, and social media in the short term. But in the long run, a company's stock reflects the actual health of the business. Financial reports tell you what that health looks like.
There are three main documents inside every financial report. Each one answers a different question.
Document 1: The Balance Sheet
The question it answers: What does this company actually own and owe right now?
The Balance Sheet is a snapshot of the company's financial position on one specific day. It's built on one simple equation:
Assets Liabilities = Equity
In plain English: what they own, minus what they owe, equals what they're actually worth.
Assets are everything the company owns. This includes obvious things like cash in the bank and physical equipment, but also things like inventory sitting in warehouses, money customers owe them, and long-term investments.
Split these into two groups:
- Current Assets things that will become cash within the next year (cash, stock inventory, receivables)
- Non-Current Assets long-term things like property, factories, and equipment
Liabilities are what the company owes. Loans, bills they haven't paid yet, money owed to suppliers.
- Current Liabilities debts due within the next year
- Non-Current Liabilities longer-term debt like bonds and multi-year loans
Equity is the company's true net worth. If you sold everything and paid off all the debts, equity is what's left. Growing equity over time is generally a healthy sign.
When reading a balance sheet, there are two things that should catch your eye immediately. First, is there enough in Current Assets to cover Current Liabilities? If not, they might struggle to pay their bills. Second, how much Long-Term Debt do they have, and is it growing faster than the business? Rapidly growing debt is almost always a warning sign.
Document 2: The Income Statement
The question it answers: Is this company actually making money?
Also called the Profit & Loss Statement (P&L), the Income Statement shows everything the company earned and spent over a specific period, usually a quarter or a full year. Unlike the Balance Sheet (a snapshot), this one shows movement over time.
Here's how to read it from top to bottom:
Revenue sits at the very top. This is all the money coming in from selling products or services, before any costs are taken out. You want to see this number growing. If revenue is shrinking, that's a company that's losing customers or market share.
Cost of Goods Sold (COGS) is what it directly costs to make or deliver whatever they sell. A factory paying for materials and workers' wages is an example. Revenue minus COGS gives you the Gross Profit.
Operating Expenses are the overhead costssalaries for office staff, marketing budgets, rent, technology. These are real costs that come out before you know the actual profit.
Net Income is what's at the very bottom, and it's the number everyone talks about. After subtracting all expenses and taxes, this is the profit. If it's consistently positive and growing, that's a company that's financially moving in the right direction. If it keeps going negative, the company is spending more than it earnsand that's unsustainable.
One beginner mistake: don't just look at one quarter in isolation. Look at the trend. Is Net Income growing quarter over quarter, year over year? That trend tells a much more complete story than any single number.
Document 3: The Cash Flow Statement
The question it answers: Where is the actual money going?
This is the one most beginners skip. That's a mistake, because this document is arguably the most honest of the three.
Here's why: accounting rules allow companies to record revenue before they actually receive the money. A company can look profitable on the Income Statement while having almost no real cash in hand. The Cash Flow Statement cuts through that.
It's divided into three sections:
Operating Activities Is the company's actual day-to-day business generating cash? This is the most important number. A business can survive a bad quarter, but a company that consistently can't generate cash from its operations has a serious problem.
Investing Activities This tracks money spent on things like buying new equipment, acquiring other businesses, or selling assets. Negative numbers here aren't necessarily badit might mean the company is reinvesting in growth.
Financing Activities Money coming in from issuing new stock or taking on debt, and money going out to repay loans or pay dividends. This section helps you understand how the company is funding itself.
The number to pay close attention to is called Free Cash Flow. It's basically operating cash flow minus what the company spent on maintaining and expanding its physical assets (capital expenditures). Free Cash Flow is real, spendable money. Companies with strong, consistent Free Cash Flow can reward shareholders, pay off debt, and weather tough times. That's a quality company.
How to Actually Start Using This
Knowing the theory is one thing. Here's how to put it into practice:
Start with the annual report, not the quarterly. The annual report (called a 10-K for US-listed companies) gives you the full picture. Quarterly reports (10-Q) are useful once you're tracking a company over time, but the annual report is your starting point.
Read the MD&A section first. MD&A stands for Management's Discussion and Analysis. It's written in plain language by the company's leadership and explains what happened that year and why. This gives you context before you dig into the numbers.
Compare at least three years of data. One year of data can be misleading. Three years shows you a real trend: is revenue growing? Is debt under control? Is Free Cash Flow expanding?
Use financial websites to cross-reference. Sites like Macrotrends, Yahoo Finance, or Morningstar lay out historical financial data in easy-to-read tables. Use these to speed up your analysis.
Practice on companies you already know. Pull up the financial reports for a brand you use every day. You already understand their business intuitively, so it's much easier to connect what you read in the report to what you already know about the company.
You Won't Get It Perfectly Right Awayand That's Fine
Reading financial reports is a skill, not an instant ability. The first time you open one, it will probably feel overwhelming. The fifth time, it will feel manageable. The twentieth time, you'll know exactly where to look and what questions to ask.
Every great investor started exactly where you are. The difference between them and most people? They kept reading and kept practicing until the numbers started telling a story rather than just sitting there.
That's the goal: to hear the story the numbers are telling. Because once you can do that, you're not guessing anymore.
- Bottom Line: Financial reports aren't for accountantsthey're for anyone who wants to make informed decisions about where they put their money. Learn to read the Balance Sheet, the Income Statement, and the Cash Flow Statement, and you'll have a significant edge over investors who never bother to look.





















All comments, feedback, information or materials except email addresses submitted to Lush Wush shall be considered non-confidential and its property. By submitting such comments, feedback, information or materials to us, you agree to a no-charge assignment of all worldwide rights. For the best interest of the community, please refrain from posting vulgar comments, profanity, or personal attacks. Comments submitted may automatically be flagged for review by our moderation team before appearing on the website.