
How To Read Financial Reports: A Beginner Investors Survival Guide
 130
130  0
0  17
17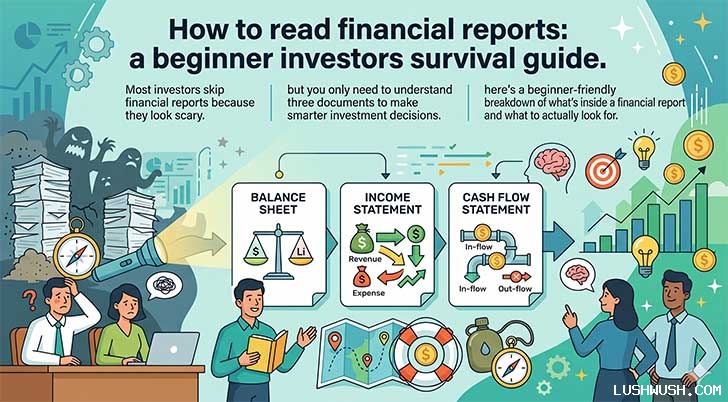

How to Read Financial Reports: A Beginner Investor's Survival Guide
The One Great Quarter That Wasn't What It Looked Like
Owen saw the headline before he saw anything else: net income had jumped from $2 million to $12 million in a single quarter. He pulled up the press release, saw the huge number, and invested $4,000 that same afternoon.
What he didn't check was where that $12 million actually came from. The company had sold off a subsidiary warehouse business that quarter an $11 million one-time gain that had nothing to do with how the actual core business was performing. If Owen had looked at the Cash Flow Statement, he'd have seen operating cash flow sitting at negative $5 million, negative $8 million, and negative $6 million across the three years before that flashy quarter. The core business had been bleeding cash the entire time; the "great quarter" was a one-time sale wearing a profit's clothing.
His coworker Fatima got curious about the same company, pulled three years of annual reports off Macrotrends, and spotted that negative operating cash flow trend inside about ten minutes. She passed, and put her own $4,000 into a company with three straight years of positive, growing free cash flow instead.
Six months later, with no more one-time gains to hide behind, Owen's company reported a loss again and the stock dropped 40%. His $4,000 was worth $2,400. Fatima's pick had climbed about 25% over the same stretch, turning her $4,000 into roughly $5,000. Same starting amount, same six months, a $2,600 gap created by one habit: checking more than a single flashy number before buying.
What Is a Financial Report, Actually?
Think of a financial report as a company's official update to the world, released quarterly (every three months) and annually (once a year). Inside are the numbers that tell you whether a business is genuinely healthy, growing, struggling, or quietly hiding something behind a good headline exactly the kind of thing that fooled Owen. Stock prices can be driven by hype and social media in the short term, but over the long run, a company's stock reflects the actual health underneath it. Three documents inside every report tell you what that health looks like.
Document 1 The Balance Sheet: What They Actually Own and Owe
The Balance Sheet is a snapshot of the company's financial position on one specific day, built on a simple equation: Assets Liabilities = Equity. In plain terms: what they own, minus what they owe, equals what they're actually worth.
Current vs. Non-Current: Why the Split Matters
Assets split into current assets cash, inventory, money owed by customers, anything convertible to cash within a year and non-current assets, like property and long-term equipment. Liabilities split the same way: current liabilities due within a year, and non-current liabilities like bonds and multi-year loans. This split matters because a company can have plenty of total assets on paper while still struggling to cover what's due in the next twelve months specifically.
The Two Numbers That Should Catch Your Eye Immediately
First: is there enough in current assets to cover current liabilities? If not, near-term bill-paying could genuinely become a problem. Second: how fast is long-term debt growing relative to the business itself? A company whose long-term debt grew 30% while revenue grew only 10% is taking on financial risk considerably faster than it's building the income to support it almost always worth a closer look before investing further.
Document 2 The Income Statement: Is This Company Actually Making Money?
Also called the Profit & Loss Statement, the Income Statement shows everything earned and spent over a period a quarter or a full year unlike the Balance Sheet's single-moment snapshot.
From Revenue to Gross Profit: What COGS Tells You
Revenue sits at the top everything coming in before costs are subtracted. Below it, Cost of Goods Sold (COGS) covers what it directly costs to make or deliver whatever's being sold materials, direct labor. Revenue minus COGS gives you Gross Profit, which tells you how efficiently the core product itself is priced, before overhead like salaries, marketing, and rent (Operating Expenses) gets subtracted to reveal the real bottom line.
Why One Quarter Never Tells the Whole Story
This is exactly where Owen went wrong. Net Income, the very bottom number after everything's subtracted, is the figure everyone fixates on but a single quarter's Net Income can be quietly inflated by one-time events that have nothing to do with the ongoing business, the way that $11 million subsidiary sale inflated Owen's target company for exactly one quarter. Always check the trend across several periods, not just the most recent, most exciting-looking one.
Document 3 The Cash Flow Statement: Where the Money Actually Goes
This is the document most beginners skip, and it's the one that would have saved Owen $1,600. Accounting rules allow companies to record revenue before actually collecting the cash, so a business can look profitable on the Income Statement while holding almost no real cash. The Cash Flow Statement cuts straight through that.
The Three Sections (And Why "Negative" Isn't Always Bad)
- Operating Activities is the actual day-to-day business generating cash? This is the single most important number in the entire document
- Investing Activities money spent on equipment, acquisitions, or asset sales. A negative number here often just means healthy reinvestment in growth, not trouble though a large positive spike from a one-time asset sale, like Owen's company, deserves real scrutiny rather than celebration
- Financing Activities cash from issuing stock or taking on debt, versus cash going out to repay loans or pay dividends, showing how the company actually funds itself
Free Cash Flow: The Number That Would Have Saved Owen $1,600
Free Cash Flow is operating cash flow minus what the company spent maintaining and expanding its physical assets. It's real, spendable money and it's exactly the number that exposed the three straight years of negative operating cash flow sitting underneath Owen's exciting quarter. Companies with strong, consistent free cash flow can reward shareholders, pay down debt, and survive rough stretches. That's the marker of a genuinely quality business, not just a good headline.
Real-World Example: The Quarter That Fooled Owen (But Not Fatima)
Laid out directly, here's exactly what Fatima saw that Owen missed:
- The headline number: Net income jumped from $2M to $12M in one quarter
- The real driver: An $11M one-time gain from selling a subsidiary an Investing Activities event, not core operations
- Three years of operating cash flow leading up to that quarter: $5M, $8M, $6M consistently negative the entire time
- What happened next quarter, without the one-time gain: the company reported a loss again, and the stock fell 40%
- Owen's outcome: $4,000 invested right after the flashy quarter $2,400 six months later
- Fatima's alternative pick (three straight years of positive, growing free cash flow: $3M $5M $7M): $4,000 invested $5,000 over the same period
The entire gap traces back to one document Owen never opened.
How to Actually Start Using This (A Practical System)
- Start with the annual report (10-K), not the quarterly. It gives you the full year's picture; quarterly reports (10-Qs) are more useful once you're already tracking a company over time
- Read the MD&A section first. Management's Discussion and Analysis is written in plain language by company leadership and explains what happened that year and why including context for unusual one-time items exactly like Owen's subsidiary sale
- Compare at least three years of data, not one. A single year can mislead; three years reveals a genuine trend in revenue, debt, and free cash flow
- Cross-reference on a second source. Sites like Macrotrends, Yahoo Finance, or Morningstar lay out historical data in clean, comparable tables and help catch anything that looks off
- Practice on a brand you already use. Pulling up the financial reports for a company whose business you intuitively understand makes it far easier to connect the numbers to what you already know is true
Common Mistakes Beginner Investors Make (What NOT to Do)
- Getting excited about one flashy quarter without checking whether the driver was core operations or a one-time gain, exactly as happened to Owen
- Confusing Gross Profit with Net Income, assuming a healthy gross margin automatically means the whole business is profitable once overhead is included
- Assuming negative Investing Activities cash flow is automatically bad, when it's frequently just healthy reinvestment in future growth
- Starting with the quarterly report instead of the annual one, missing the fuller multi-year picture a 10-K provides
- Skipping the MD&A section entirely, missing management's own plain-language explanation of unusual items
- Judging a company off a single year of data instead of the minimum three years needed to spot a real trend
- Never cross-referencing numbers on a second site, missing context or catching errors that a single source alone might not reveal
Your Practical Action Plan to Start Reading Reports This Week
- Pick one company's most recent 10-K (annual report) to start with, ideally one you're already curious about or invested in
- Read the MD&A section first for plain-language context before diving into the raw numbers
- Pull three years of revenue, net income, and free cash flow and lay them side by side
- Specifically check whether any standout quarter or year was driven by a one-time gain, cross-referencing Investing and Financing Activities
- Cross-reference the same numbers on Macrotrends, Yahoo Finance, or Morningstar to confirm consistency
- Practice this full process on a brand you personally use, since your existing intuition about the business will make the numbers click faster
- Only invest once the multi-year trend, not a single headline number, actually supports the decision
Beginner FAQ: Reading Financial Reports as a Beginner
What's the difference between a 10-K and a 10-Q, and which should I read first? A 10-K is the annual report, covering a full fiscal year in depth, including the MD&A section. A 10-Q is the quarterly report, shorter and less detailed, better suited for tracking a company you're already familiar with. Start with the most recent 10-K to get the full picture before layering in quarterly updates.
What's the difference between Gross Profit and Net Income? Gross Profit is revenue minus the direct cost of producing what's sold (COGS) it tells you how efficiently the core product is priced. Net Income is what's left after everything else is subtracted too: overhead, salaries, marketing, taxes, and interest. A company can have excellent Gross Profit and still post a loss if operating expenses are out of control.
Is negative cash flow from Investing Activities always a bad sign? No, and this trips up a lot of beginners. Negative Investing Activities cash flow often just reflects a company spending money on equipment, facilities, or acquisitions to fuel future growth. What deserves real scrutiny is the opposite pattern an unusually large positive spike from a one-time asset sale, exactly the pattern that made Owen's target company look far healthier than it actually was.
How many years of data do I actually need to look at before I trust a trend? Three years is a commonly used minimum for a reason it's enough to distinguish a genuine, sustained trend from a single unusual year in either direction. Where possible, five years gives an even clearer picture, particularly for spotting whether debt growth or cash flow patterns are accelerating or leveling off.
Owen's $1,600 loss wasn't bad luck it was one skipped document. Fatima's extra ten minutes on Macrotrends wasn't a special talent, either; it was three years of data laid side by side instead of one quarter taken at face value. That's the entire skill being built here: not predicting the future, just reading what the company has already told you, in full, before deciding where your money goes.
- Once you've found a company whose numbers actually hold up across multiple years, the next step is letting time and compounding do the heavy lifting. Use our free Visual Compound Interest & SIP Calculator to see how your investment could grow over the years ahead.





















All comments, feedback, information or materials except email addresses submitted to Lush Wush shall be considered non-confidential and its property. By submitting such comments, feedback, information or materials to us, you agree to a no-charge assignment of all worldwide rights. For the best interest of the community, please refrain from posting vulgar comments, profanity, or personal attacks. Comments submitted may automatically be flagged for review by our moderation team before appearing on the website.